JVM & cloud performance
Project Leyden and the Architecture of JVM Warmup
How ahead of time caching changes startup performance and autoscaling decisions

Abstract
A Java service can pass its readiness check before it can sustain its intended traffic within a latency objective. Project Leyden addresses part of this gap by moving repeatable JVM work into earlier executions and reusing the resulting artifacts. Its delivered features accelerate class loading and linking, preserve method profiles, and broaden garbage collector support for cached objects. The architectural opportunity is to shorten the time between starting a replica and obtaining dependable capacity from it. This paper explains the underlying mechanisms and proposes a measurement and deployment approach for Java services on Kubernetes. It is a technical analysis and evaluation proposal; it does not claim original benchmark results.
The gap between readiness and useful capacity
Consider a service scaling out during a traffic burst. New containers start, the HTTP server opens its port, and readiness checks succeed. Requests arrive while the JVM is still learning which methods matter. Application caches and connection pools may also be filling. The replica is available, but its response times and sustainable throughput can still be changing.
This distinction matters when a capacity plan assigns every ready replica the throughput of an established instance. A rollout or sudden scale out can create a fleet whose nominal capacity exceeds what it can actually deliver within the service level objective, or SLO.
I propose measuring time to useful capacity: elapsed time from process launch until a replica sustains a predefined request rate, latency target, and error budget for a specified observation window. An example acceptance criterion is sustaining the target load for three consecutive 30 second windows. The rate, percentile, sample size, and duration must fit the service; these are measurement choices, not universal JVM thresholds.
Measure demand detection to useful fleet capacity separately. That interval also includes the autoscaler, scheduling, node provisioning, image pulls, and traffic routing. Leyden can improve the JVM portion without materially changing a deployment dominated by those other delays.
What HotSpot does while a service warms up
Class loading, linking, initialization, and execution overlap during startup. HotSpot must make class definitions usable, while the application performs work such as configuration discovery and dependency setup. Class initialization can execute application code and perform I/O. Caching loaded and linked classes does not automatically precompute all those application side effects. OpenJDK JEP 483.
With tiered compilation, execution can begin in the interpreter and move through compiled forms. C1 produces code quickly and can retain profiling instrumentation; C2 performs more expensive optimization. Observations about execution guide compilation decisions. This is adaptive behavior: methods do not all pass through an identical, fixed sequence of compilation levels. Generated machine code occupies the JVM code cache, which is distinct from the Java heap. HotSpot performance documentation.
For example, a payment dispatch method may usually receive one concrete implementation of an interface. A type profile can make an inlining opportunity visible to the compiler. If later execution invalidates an optimization assumption, HotSpot can deoptimize and resume through a less specialized execution path. This ability to respond to actual execution is part of the JVM's dynamic optimization model. OpenJDK JEP 483.
For an architect, the consequence is that startup consumes a changing resource mix. Request handling and compilation share finite CPU capacity. Under a container CPU quota, moving useful compilation earlier might improve initial throughput, but the CPU budget still constrains how quickly that work completes. Measure CPU throttling alongside latency before attributing a slow ramp entirely to the compiler.
What Leyden has delivered
Leyden is an incremental OpenJDK project focused on startup time, time to peak performance, and footprint. The practical baseline for this paper is the functionality delivered in JDK 24 through 26, available to evaluate in subsequent releases. Project Leyden.
| Release | Feature | Architectural relevance |
|---|---|---|
| JDK 24 | JEP 483 class loading and linking | Reuses eligible classes in a prepared state across launches |
| JDK 25 | JEP 514 command line ergonomics | Simplifies producing a cache from a training run |
| JDK 25 | JEP 515 method profiling | Gives the JIT earlier access to information learned during training |
| JDK 26 | JEP 516 object caching with any GC | Extends cached object optimizations to collectors including ZGC |
The release mapping comes from the Leyden project status. These features address different work; their benefits should not be added as independent percentage improvements.
Ahead of time class loading and linking builds on Class Data Sharing, or CDS. A training execution identifies relevant classes, and an assembly step creates an AOT cache. Later executions can reuse eligible class state. Classes outside the cache can still follow normal runtime loading. An evaluation should retain the baseline JDK's ordinary CDS behavior, so that it measures the incremental benefit of the application AOT cache. OpenJDK JEP 483.
Method profiling changes another part of the timeline. JDK 25 can preserve execution profiles from training so the JIT can start generating useful native code sooner, instead of collecting all of that information afresh. Profiles describe observed execution; they are not themselves compiled machine code. Oracle Java 25 technical announcement.
JEP 516 addresses how cached Java objects are loaded. Directly mapping a stored object representation into the heap creates compatibility constraints between collectors. JDK 26 adds a loading mechanism compatible with differing GC layouts, including ZGC. This concerns objects supported by the AOT cache; it does not imply that an application's complete live heap, open sockets, or database sessions are restored. JDK 26 release notes.
As of this paper's date, ahead of time machine code reuse is a separate development effort tracked by JEP 544. Its implementation review describes storing optimized native code for subsequent runs. This paper does not assume that proposal is delivered in JDK 27, and its commands do not depend on it. OpenJDK implementation review.
Training becomes part of the release process
The operational workflow is straightforward: run representative behavior, assemble a cache, and deploy that cache with the matching application and runtime. JDK 25's AOTCacheOutput option combines training and subsequent cache assembly into one launcher workflow. Training must finish so assembly can complete. Inside Java AOT cache guide.
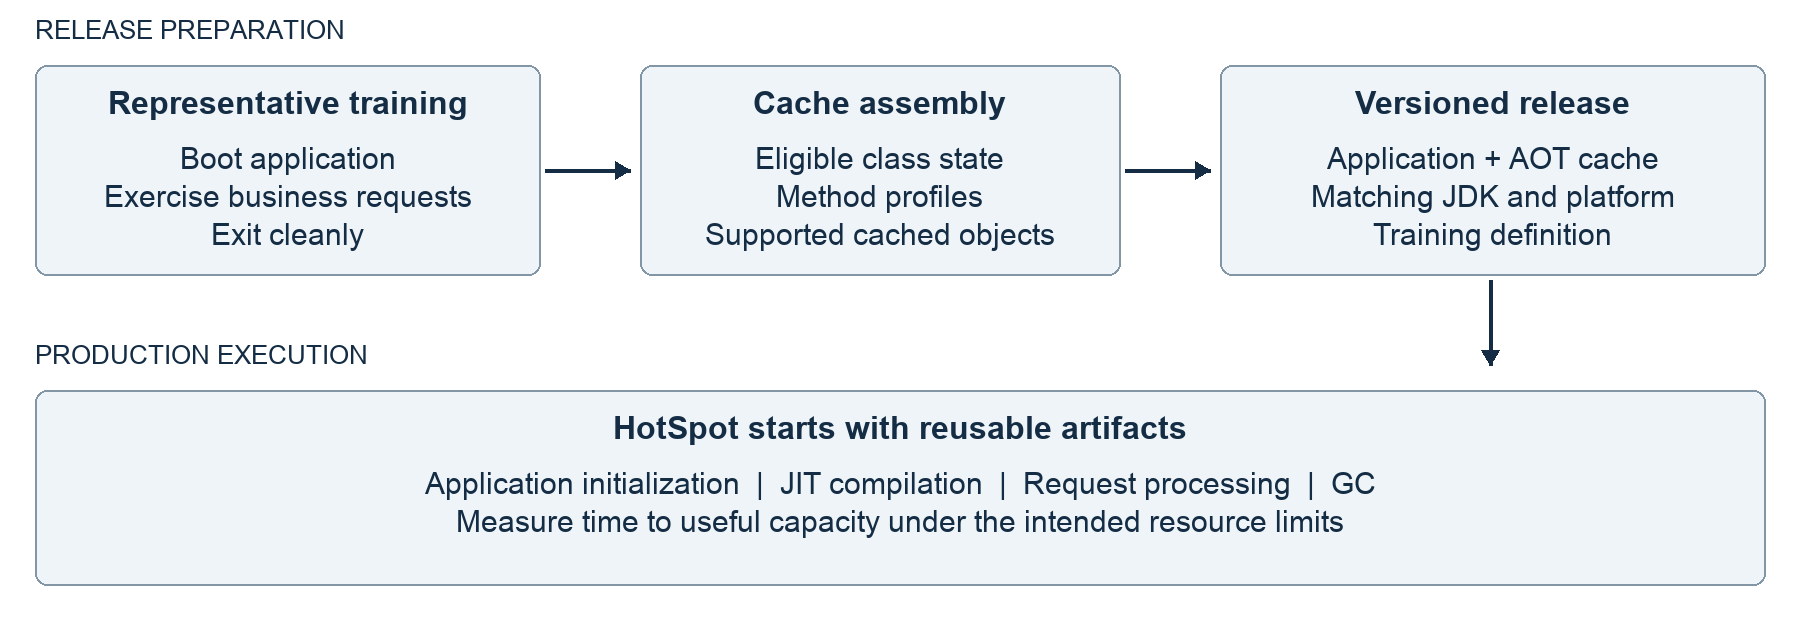
The quality of that training is now an engineering responsibility. A startup-only run may prepare classes used during boot while barely exercising business methods. A service with JSON serialization, authorization checks, and several dispatch implementations needs representative requests if the objective includes method-profile benefits.
Training should approximate important execution shapes: endpoint mix, payload sizes, concrete receiver types, and common error paths. Include rare paths when their first-use latency is critical, but distinguish that goal from reproducing normal traffic proportions. Exhaustive test coverage and representative profiling are different objectives. Artificially uniform traffic can hide the skew that production actually exhibits.
Use a bounded training environment with controlled dependencies and synthetic data. Record the workload definition, application revision, JDK build, operating system, CPU architecture, and relevant launch configuration. These records make a performance regression explainable: a changed profile can matter even when the application source is unchanged.
Cache compatibility and profile quality require separate checks. A cache can be accepted by the JVM while the training workload poorly represents current traffic. Conversely, a useful training workload cannot rescue an incompatible artifact. The JDK documents application, runtime, OS, and architecture compatibility constraints, along with command line and instrumentation restrictions. Java launcher reference.
Treat the application image and its cache as an immutable release pair. Rebuild and revalidate on runtime or application changes. Preserve the prior pair for rollback. Test with the actual monitoring agents and launch scripts, because the deployed environment can differ from a developer's successful local experiment.
Measuring the capacity that autoscaling adds
Replica counts describe deployment state. A useful-capacity curve describes how much work newly created replicas can sustain while meeting the SLO. Estimate that curve through repeated launches under controlled traffic, and aggregate it only where replicas have comparable workloads and independent resource budgets.
An illustrative example makes the distinction concrete. Suppose an established replica sustains 500 requests per second within the SLO. Ten new replicas currently sustain only 200 each. They contribute 2,000 requests per second, equivalent to four established replicas at that moment. Those numbers are assumptions for illustration, not Leyden measurements. Shared database limits, uneven routing, and contention can make simple addition too optimistic.
The useful question for a Leyden trial is whether the capacity curve rises earlier without harming latency, errors, or eventual throughput. A readiness timestamp alone cannot answer it. A lower startup CPU total alone cannot answer it either: the distribution of CPU work over the first minute can determine whether requests meet their deadlines.
Kubernetes already accounts for startup complications in CPU-based autoscaling. HPA uses readiness and initialization logic when deciding which CPU samples to include. Its documented defaults include a five minute CPU initialization period and a 30 second initial readiness delay; these are controller settings, not a guarantee that every new Pod's metrics are ignored for five minutes. Kubernetes HPA documentation.
Validate these behaviors on the deployed cluster. Depending on the service, request rate, queue depth, or concurrency may provide useful additional scaling signals. Their targets still need to reflect downstream limits and the transient capacity of new replicas.
Readiness should indicate the ability to accept the traffic that routing will send. Waiting for every possible path to become fully optimized is usually impractical. A bounded warmup routine and gradual traffic admission can be evaluated where needed. A fixed sleep is weak evidence of readiness because it cannot distinguish slow dependencies, CPU starvation, and successful initialization.
For fleet design, retain enough established capacity to cover measured scale-out delay and realistic failures. Leyden may allow that reserve to shrink, but only if repeated burst and rollout tests show that the fleet still meets its objectives. Faster JVM startup does not itself demonstrate a reduction in the infrastructure bill.
An evaluation that separates mechanism from outcome
Use one representative service and the same exact JDK build for every AOT comparison. Keep GC selection, heap settings, CPU and memory limits, application configuration, monitoring, and load generation constant. A separate upgrade experiment can compare JDK releases; combining both changes obscures attribution.
| Trial | Training and runtime setup | Question answered |
|---|---|---|
| Baseline | No application AOT cache; ordinary JDK CDS retained | How does the service behave today on this build? |
| Startup training | Cache created after application boot | How much does a minimal training workflow help? |
| Representative training | Cache created after a defined request mix | Does exercising business paths improve the ramp? |
| Workload shift | Same trained cache; a different request mix | How sensitive is the benefit to traffic changes? |
| Fallback | Cache deliberately unavailable in a test environment | What happens when the optimization is absent? |
First measure isolated launches. Then repeat under concurrent scale out, constrained CPU, and a realistic downstream dependency budget. Ten simultaneous initializations can behave differently from ten isolated runs.
Use an arrival-rate-controlled load generator on separate capacity. A client that waits for each response before issuing more work can reduce offered load precisely when the service slows, concealing the problem. Report offered requests, completed requests, errors, timeouts, and latency together. Include pre-readiness connection failures in the end-to-end availability measurement instead of silently dropping them.
For each trial, collect process-launch time, readiness time, first successful business request, and time to useful capacity. Report time-bucketed p50, p95, and p99 latency with request counts; very small windows may not contain enough samples for a meaningful p99. Add process CPU, container throttling, RSS, GC activity, cache size, and training duration. Diagnostic JFR runs can help connect changes to class loading, compilation, and application work; use comparable recording settings across variants.
Repeat independent process launches, randomize trial order, and state whether host filesystem caches and container image layers are warm. A cold JVM process on a warm host is a different experiment from a fresh node pulling the image. Publish dispersion across runs, not only the fastest result. Continue each run long enough to check eventual throughput and memory behavior.
Avoid interpreting the startup-training comparison as a perfect decomposition of class caching and profile caching: startup itself executes and profiles methods. The trials compare deployment workflows. Isolating individual JVM mechanisms requires a more targeted experiment and verified options for the exact build.
A practical starting point
The following launcher examples target JDK 25 or later. They are documentation-based templates, not executed benchmark results. Assume a compatible application packaged as app.jar, consistent launch configuration, and a controlled way to terminate the training application cleanly after exercising it.
# Start training; drive the workload externally, then exit cleanly.
java -XX:AOTCacheOutput=app.aot -jar app.jar

# In a separate launch, use the assembled cache and inspect AOT logs.
java -XX:AOTCache=app.aot -Xlog:aot -jar app.jar

# Baseline launch without an application-specific AOT cache.
java -jar app.jar
Use AOT logs to confirm actual cache use. The default automatic mode can continue without an unusable cache; successful process startup therefore does not prove the optimization was applied. Include a cache-use assertion in qualification and observable fallback behavior in production. Java launcher reference.
Packaging matters. Spring Boot's documented workflow uses the extracted application for both training and production. Its context-exit training example is useful for boot-time work, but exits before representative HTTP traffic can exercise business methods. Follow the instructions for the application's Boot version; for a warmup experiment, keep the extracted application running through the chosen training workload before shutting it down. Spring Boot AOT cache documentation.
Choosing where to invest
Prioritize services with frequent launches, material JVM warmup, and a training workload the team can maintain. For long-lived, infrequently restarted services, reliability during replacement may justify the work even when direct cost savings are small. When image pulls, remote configuration, or database initialization dominate the delay, measure and address those constraints alongside JVM work.
Keep the deployment options distinct. GraalVM Native Image produces a standalone native executable using static reachability analysis and a closed-world model. The delivered Leyden cache workflow described here runs the application on HotSpot and supplies reusable startup artifacts and profiles. They imply different build, compatibility, and operational choices. GraalVM Native Image basics, Inside Java AOT cache guide.
Choose through service-level evidence: first-request latency, useful-capacity ramp, steady-state efficiency, framework compatibility, observability, and release complexity. A universal winner cannot be inferred from a startup benchmark on another application.
Leyden makes some of the work repeated at every launch reusable across a release. The architectural responsibility is to turn that mechanism into dependable capacity: train representative behavior, validate cache use, measure the ramp under constraints, and adjust routing and scaling from the evidence. That is how a JVM optimization becomes a justified deployment decision.